A good question was brought up by my students in the lab exercise in the course Electronics I yesterday: What actually makes the cut-off frequency of a filter circuit (1st order) so special? Why do we look out for a point which happens to be located  or a factor of
  under the amplitude of the pass band? Why not
  ,
,  ,
,  ?
?
The first answer, which has some historical relevance, would be to look at a resistor  and a signal with an amplitude
  and another signal with an amplitude
  while calculating the electrical power:
[ P_0 = frac{V_0^2}{R}qquad P_1 = frac{V_1^2}{R} = frac{left(V_0,sfrac{1}{sqrt{2}}right)^2}{R} = frac{1}{2},P_0 ]
The power has been reduced to half the original power, it could be the electric power which is converted to sound waves in a speaker, or the power converted to electromagnetic waves in an antenna.
But already here we can make one important observation: ![20log_{10}left(sfrac{1}{sqrt{2}}right)=SI[output-decimal-marker={.}]{-3.0103}{dB}approxSI{-3}{dB}](https://www.sciencetronics.com/greenphotons/wp-content/ql-cache/quicklatex.com-44d2232d1795c1343fe5de3dd8944da4_l3.png "Rendered by QuickLaTeX.com")
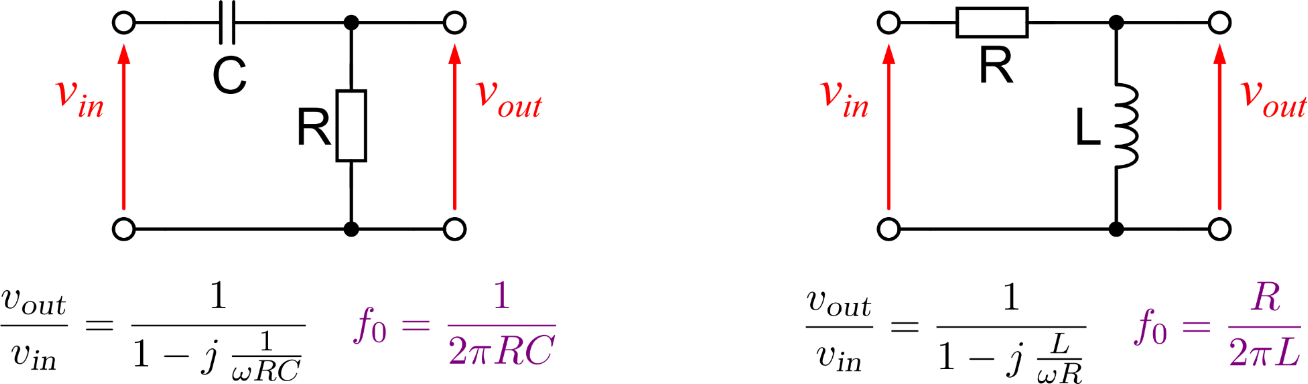
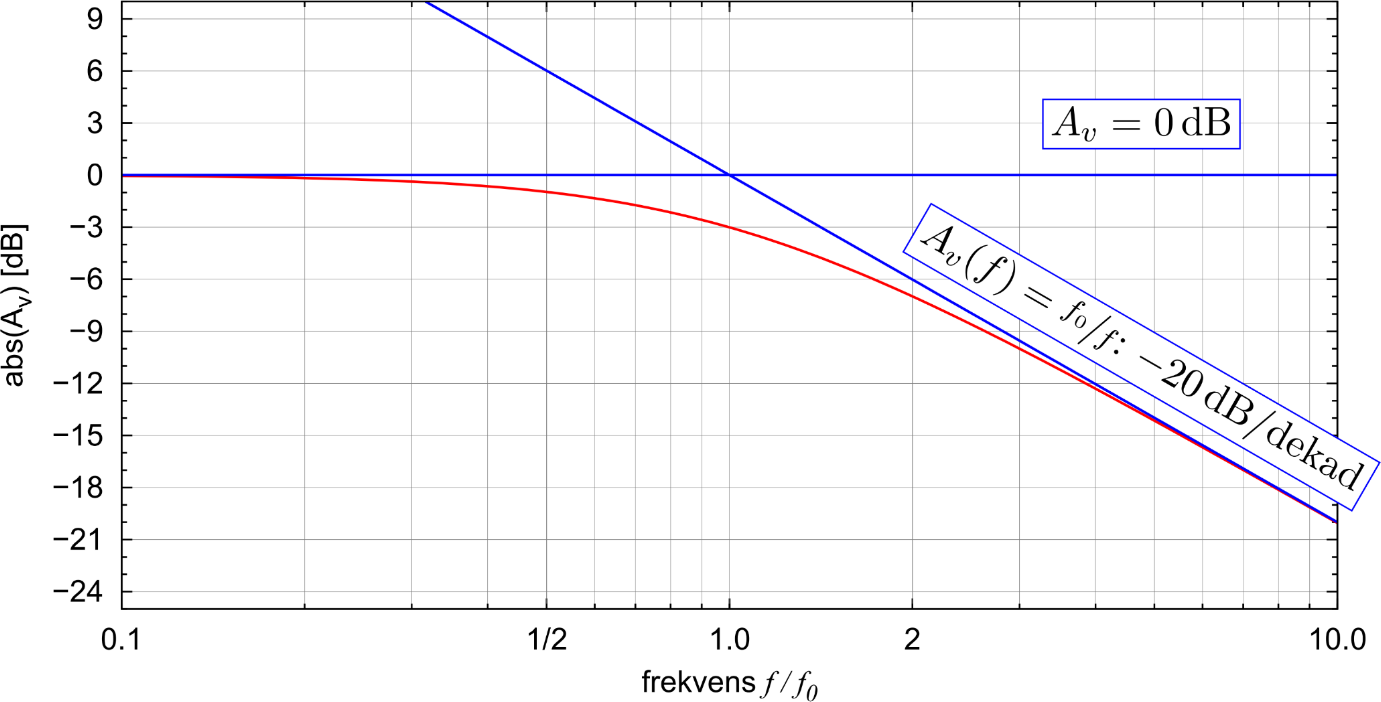
Is this everything then? It still sounds random to choose exactly this point. If we for example look at a simple RC filter then we can show another reason which makes this point’s frequency so special. In a low-pass filter we have a constant amplitude  for low frequencies while we observed mathematically and experimentally that the amplitude drops with
  per decade of frequency for high frequencies. If we draw out these two asymptotic lines in a Bode diagram, then we will find exactly one point where the lines intersect – you guessed it: it’s at the cut-off frequency (the same holds of course true for a high-pass filter). We can see this if we zoom into the area around the cut-off frequency in a Bode diagram:
Then was this everything now? Is there more about the cut-off frequency?
As we also saw we have a phase angle of  (high-pass) or
  (low-pass) between the input- and the output signal at the cut-off frequency. In the complex notation of the
  -method this correlates to the fact that the real and the imaginary part of the transfer function
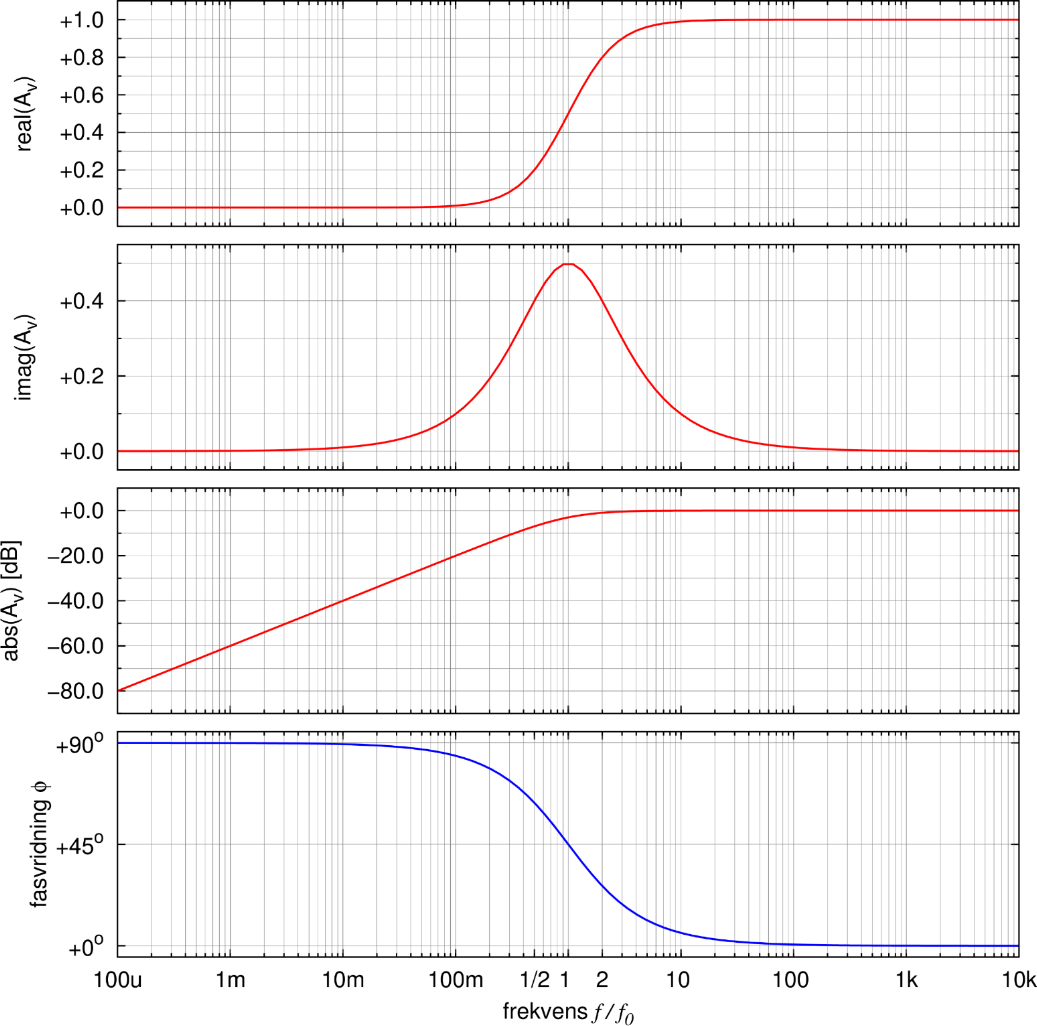
  have the same magnitude at this point. The relation between real part, imaginary part, amplitude and phase angle I have plotted below for both the low-pass and the high-pass filter.
It is interesting to observe that the imaginary part actually reaches a minimum at this point ( for the low-pass filter) or a maximum (
 for the high-pass filter), respectively.
You can see that the cut-off frequency actually is a remarkable point for a filter circuit.
Low-pass filter
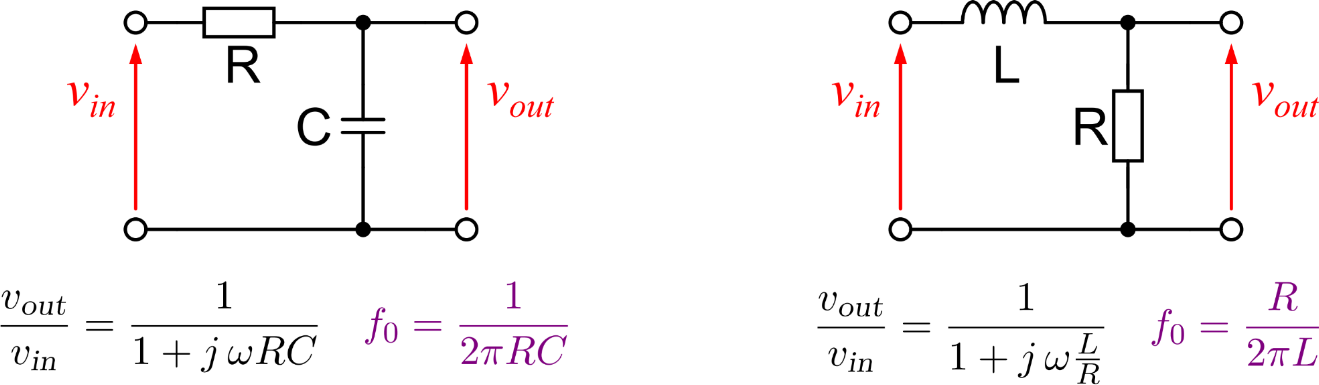

High-pass filter